Case Study Y

Appendix F

Click the 'Back' button to return to the previous page.

Below is an HTML copy of the worksheet given to pupils for the LOGO activity in Case Study Y.


Activity Worksheet

The aim of this activity is to estimate the value of p (pi) by experiment.

Theory
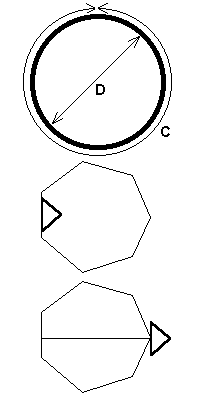
The relationship between the circumference C and diameter D of a circle is C = pi x D.
We can therefore find a value for p by dividing circumference by diameter.

To estimate a value of p, we could draw a circle, measure the circumference C and diameter D, and divide C by D. The value should be approximately 3.

Method for experiment
Using LOGO on a computer, we cannot draw true circles, but we can draw polygons. For example, we could draw a regular polygon with seven sides, each of length 20. The “circumference” of this polygon is 140 (multiply 7 by 20).

Then we could move the pointer across the middle of the polygon using the FORWARD and BACKWARD commands until we reach the other side .

If we had to move forwards 46 to reach the other side then our “diameter” is 46.

To estimate p, we divide 140 by 46, giving 3.043.

Procedure for experiment
Starting with pentagons (5 sides) and hexagons (6 sides), try different numbers and lengths of sides. As you increase the number of sides, you will need to lower the length of the sides so that the polygons will still fit on the screen. Do at least two different lengths for each number of sides.
Draw a table like the one below, and record your results as you go along.

Number of sides NLength of sides L“Circumference” C (=LxN)“Diameter” DEstimate of PI (=C/D)
5305 x 30 = 150......
5405 x 40 = 200......
6256 x 25 = 150......
...............

As the number of sides increases, the polygons will look more and more like circles, and the estimates for PI should get more accurate.

Technical information
The procedure for drawing a polygon is available on the system already.

When it is loaded, the polygon command is used as follows:

		polygon N S
where N is the number of sides and S is the length of each side.
The pointer will be left facing across the centre of the polygon.

To help you judge the distance across the middle, there is another command:

		scale N L
This draws a scale below the pointer with N sections, each of length L.

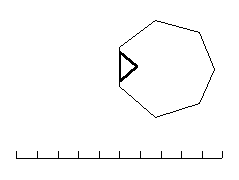
For example, the commands scale 10 10 and polygon 7 20 would produce the output shown on the right.


Assignment Quick Links
Title Page | Introduction | Contents | Case X Literature Review | Case Y Literature Review
Introduction to Cases | Case Study X | Case Study Y | Conclusions | References | Appendices